One view of their shows across audio and video.
A media team got back into its own analytics, then saw every show across video and podcasts in one place.
Views and downloads reflect one historical 30-day period. Subscriptions reflect the total at capture. Figures describe scale monitored.
Where it started
The team had video and podcast platforms full of data it could not reach. The person who had set up the analytics access had left the company, and for a long time afterwards each platform’s numbers sat in its own tool, out of reach except as files exported by hand.
EdQuantify started there, with the team. Together they restored authorized access to the video platform’s analytics. EdQuantify then coordinated with the podcast host to activate its export service, configured a dedicated destination for recurring metrics and impressions files, and connected podcast show and episode information.
The question
A company publishing video and podcasts needed to understand the performance of its shows alongside the commitments made to sponsors. Its requirements included comparing delivered impressions with guaranteed impressions, reviewing contract pacing and time remaining, and examining audience information by show.
The information came from separate content platforms and sponsorship records. Video views, podcast downloads, and listening time described different measures. Bringing the information together needed to preserve those distinctions.
What changed
With the data flowing, video and podcast analytics came together in one platform, organized by show. Each show’s channels, playlists and podcast feed counted as one show, while views, downloads and listening time stayed separate measures.
For the first time, the team could compare its five shows side by side. Each show had its own page, with delivery on each platform, week-over-week momentum, and every piece of content ranked by reach. The mapping also found 210 pieces of content, with about 535, 000 views and downloads, that no show was being credited for.
Scheduled data updates, every six hours, supported ongoing network and show reporting. A sponsor-contract library and pacing views put delivered impressions beside the impressions each sponsor was guaranteed.
The delivered result
The team gained a common view of show performance across video and podcasts, supported by recurring data feeds.
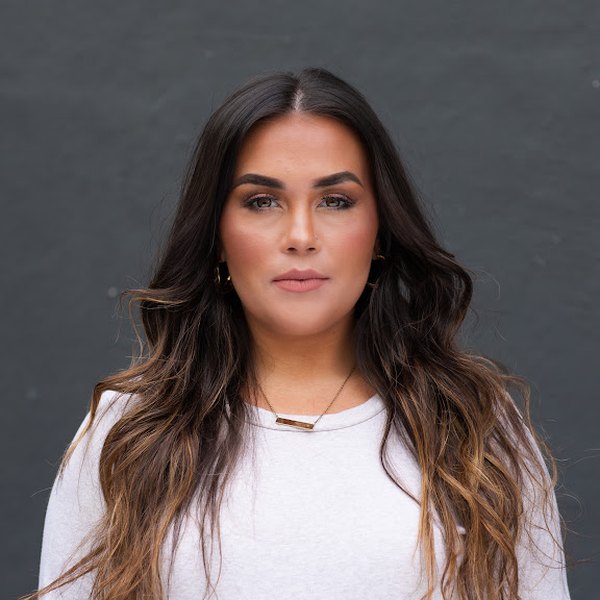 Kasey BrabhamMarketing and Sales, IRONCLAD Media Alliance
We were manually pulling all of the analytic data for all of our podcast shows, for our original content and client content. It was a horrendous task for our team to do once a month: multiple team members spending hours manually counting on certain platforms while others provided a full report.
Once EdQuantify stepped in, they made us a comprehensible, customized landing page and database that our team members could access, customize the views, and simply view all of the analytic info in one place, with one click. It saves lots of time for multiple team members. We especially loved that we could customize any dates, any show, and more with just a few clicks.
EdQuantify was not only very professional but extremely quick and very hands-on. We could fully pass all the batons over for them to curate the dashboard feed we really needed, and they went above and beyond with their thoughtful creations. We didn’t have to problem-solve anything. We handed over the keys, and in a matter of days they created exactly what we needed and more.
There really should be no hesitation to move forward with EdQuantify. They are very attentive and have great attention to detail. Artificial intelligence itself could not produce what we were after. Moving forward with EdQuantify truly changed the game for our systems and operations, and we can quickly get all the data we need for our next client sponsorships.
Kasey Brabham is a marketing and creative professional with 15+ years of experience in graphic design, web design, social media, content creation, producing, and project management. Kasey has worked with professional studios including SoundVision Studios (now HOME Studios) and currently works in Marketing and Sales at IRONCLAD Media Alliance.